Study 1
Brief description of behavioral analysis
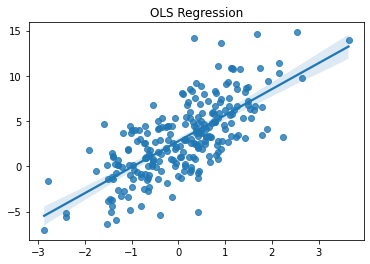
Figure 1
Brief description of some regression analysis.
import numpy as np
import matplotlib.pyplot as plt
import seaborn as sns

# set up data
np.random.seed(2021)
x0 = np.ones((250, 1))
x1 = np.random.normal(loc=0,scale=1,size=(250,1))
X = np.hstack((x0, x1))
noise = np.random.normal(2, 3, (250,1))
y = .85 + 3.05 * x1 + noise

sns.regplot(x=x1, y=y)
plt.title("OLS Regression")
plt.show()

Table 1
Summary of regression results.
from scipy.stats import linregress

slope, intercept, r, p, se = linregress(x1.flatten(), y.flatten())
if p < .001:
    p_val = 'p<.001'
else:
    p_val = f'p={p:.3f}'

print(f'For every unit increase in x, the predicted value of y increases by {slope:.2f} units.')
print(f'β1={slope:.2f}, SE={se:.2f}, {p_val}')
For every unit increase in x, the predicted value of y increases by 2.87 units.
β1=2.87, SE=0.18, p<.001